
Share this publication
Send this Chervil resource to someone who may find it useful.
Indiana and Central Indiana at a glance
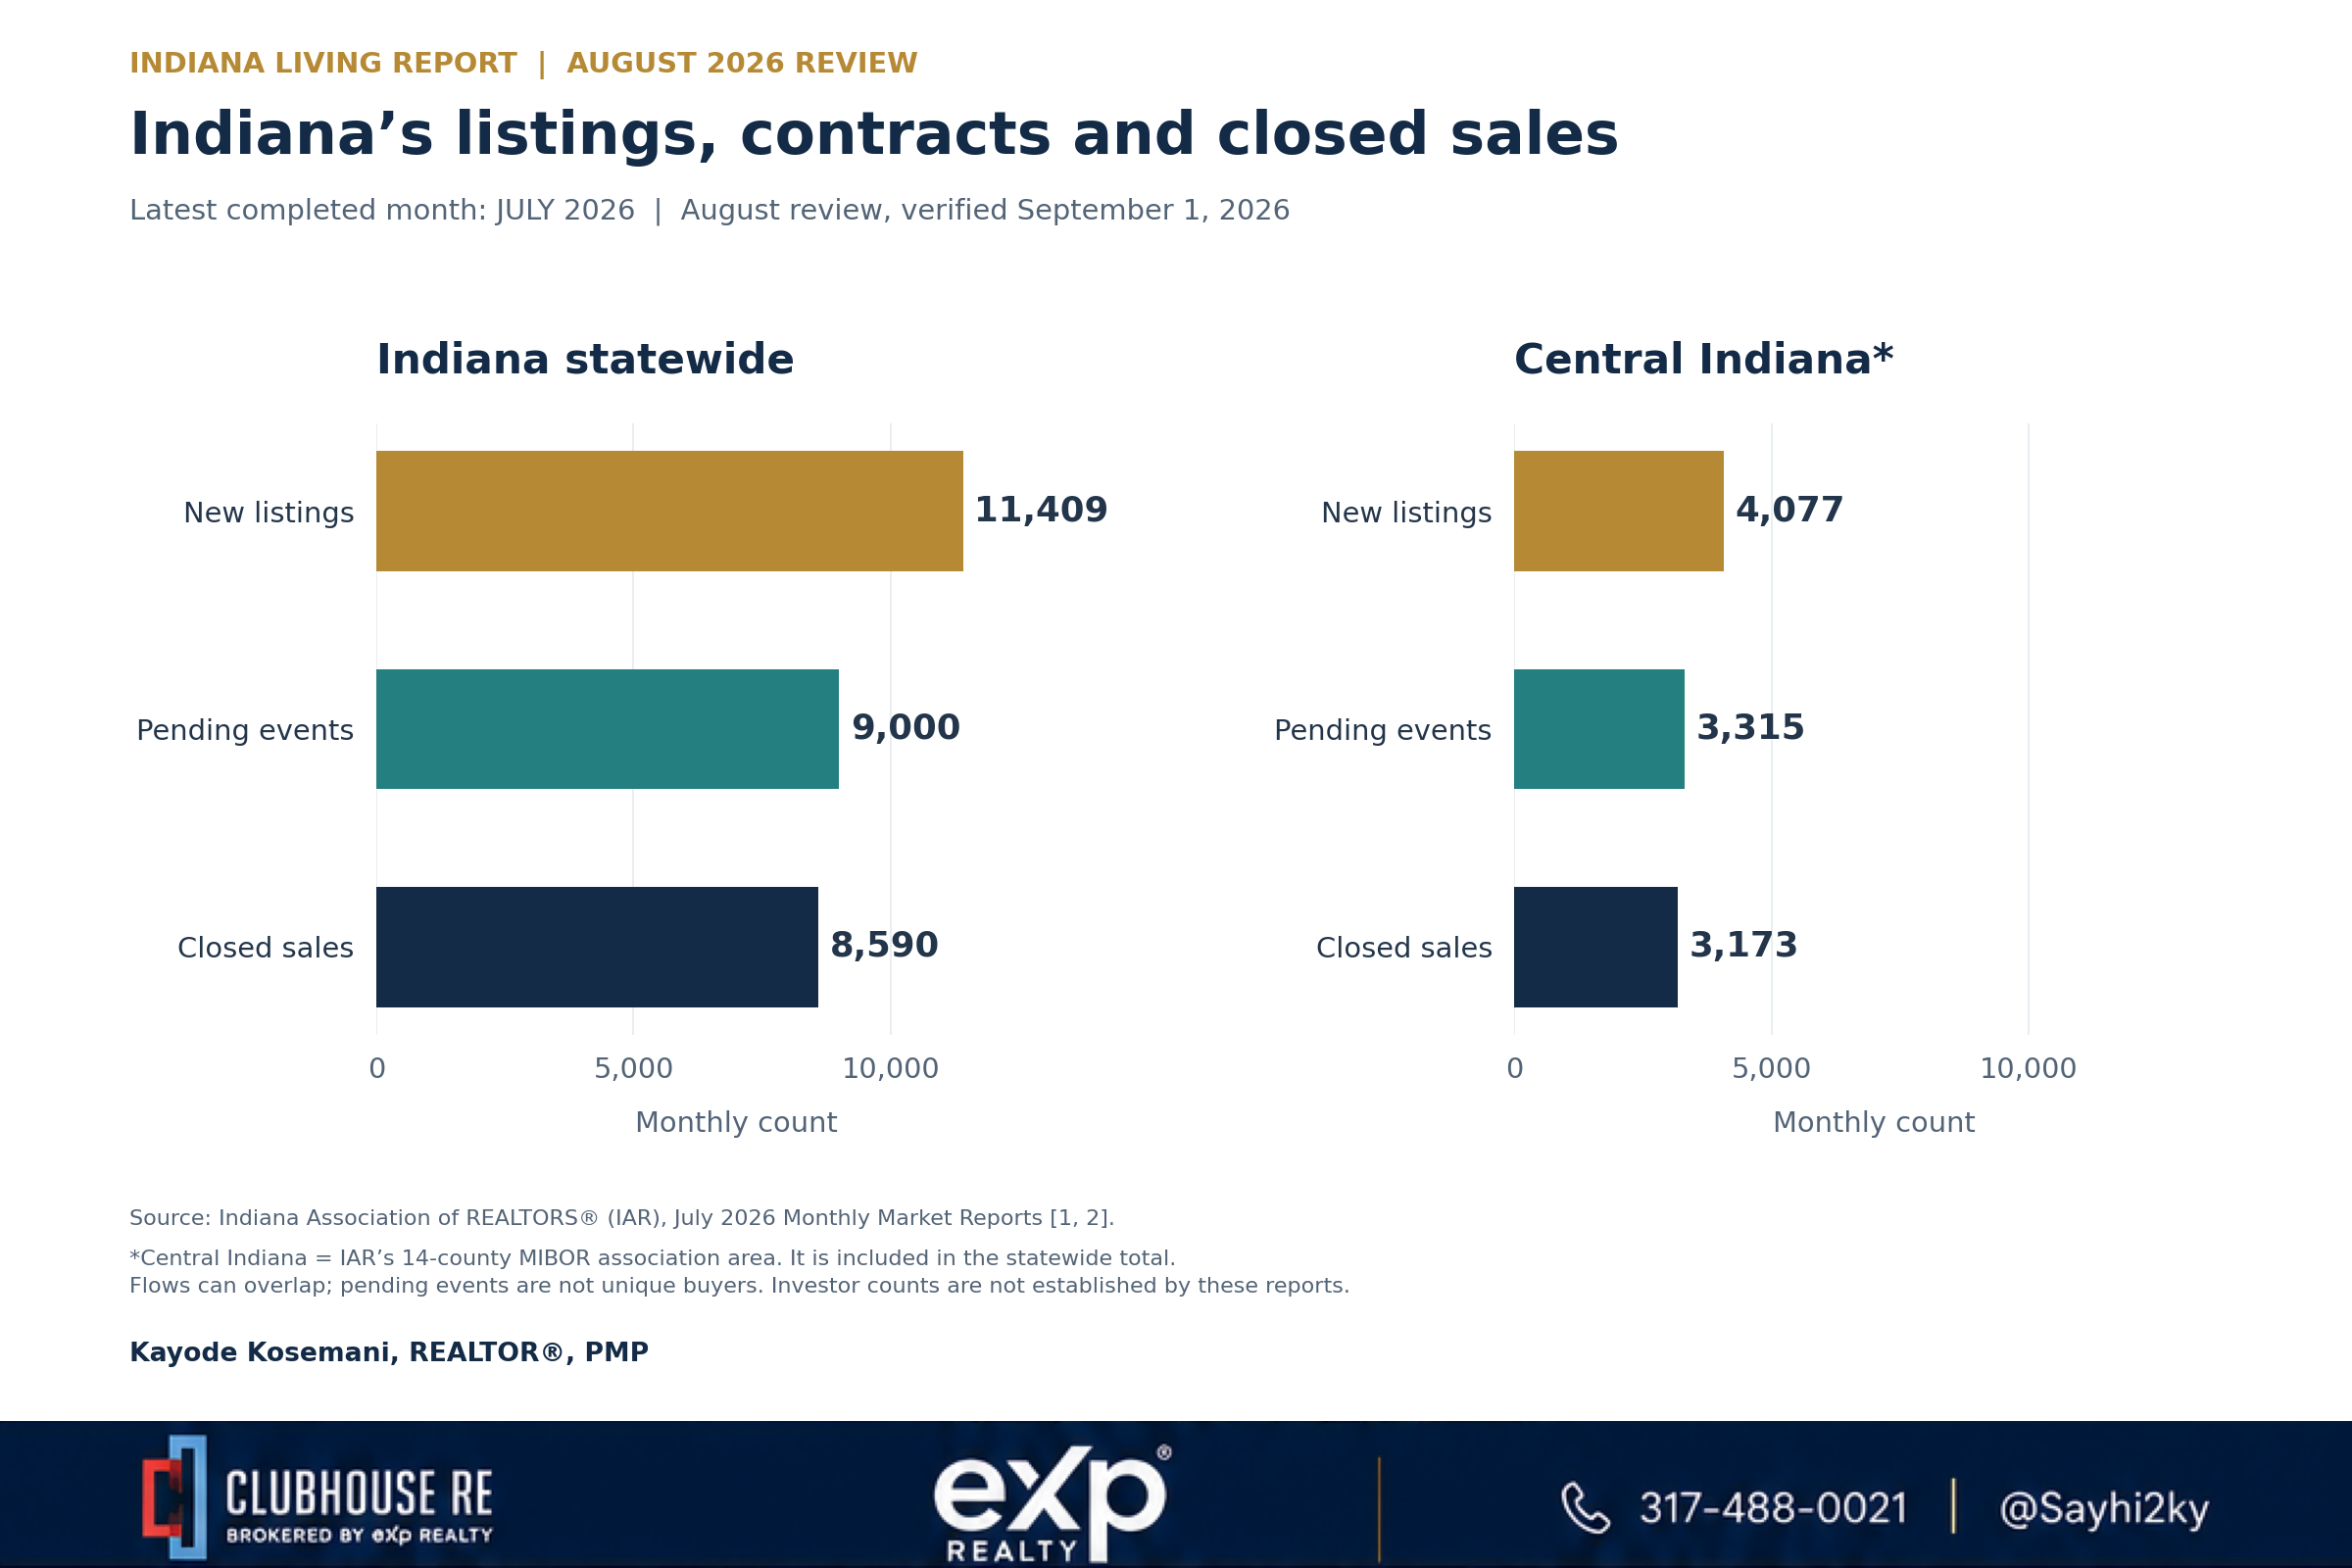
July 2026, IAR all-residential reports. Parentheses show source-reported, rounded year-over-year changes. *Central Indiana means IAR’s 14-county MIBOR association area, not Indianapolis city or the Indianapolis metro statistical area. \[1, 2]
I see a market with more supply but mixed demand signals. Statewide completed sales were higher than a year earlier, yet new pending activity was lower. The same split appeared in Central Indiana. Closings describe transactions that finished; contracts help me assess the next stage of activity. \[1, 2]
My interpretation is that buyers can be more selective, while sellers should watch nearby competing listings carefully. These figures alone do not establish a housing crash, a bargain in every neighborhood, or a guaranteed direction for the next month.
What the buyer and seller activity actually measures
I use new listings to track homes entering the market, pending events to track agreements, and closed sales to track completed transactions. They are useful measures of activity, but they are not a headcount of individual buyers, sellers or investors.
A home can appear in more than one category during the month. A contract can fall through, and IAR now counts each pending event when a listing goes under contract more than once. I therefore do not subtract contracts from listings and call the difference “unsold homes.” Average daily active inventory is the relevant supply measure here. \[14]
What August itself added to the picture
IAR’s MIBOR-area dashboard, labeled for the week of August 17, showed its recent three-week average inventory 18% above a year earlier and its three-week average new pending sales trending downward. That is a partial-month signal, not an August total. \[15]
My practical takeaway is to separate the level of activity from its direction. A market can complete more sales than last year while recent contract activity softens. That is why I want to see August’s completed report before describing the whole month as stronger or weaker.
My closer look at six Central Indiana counties
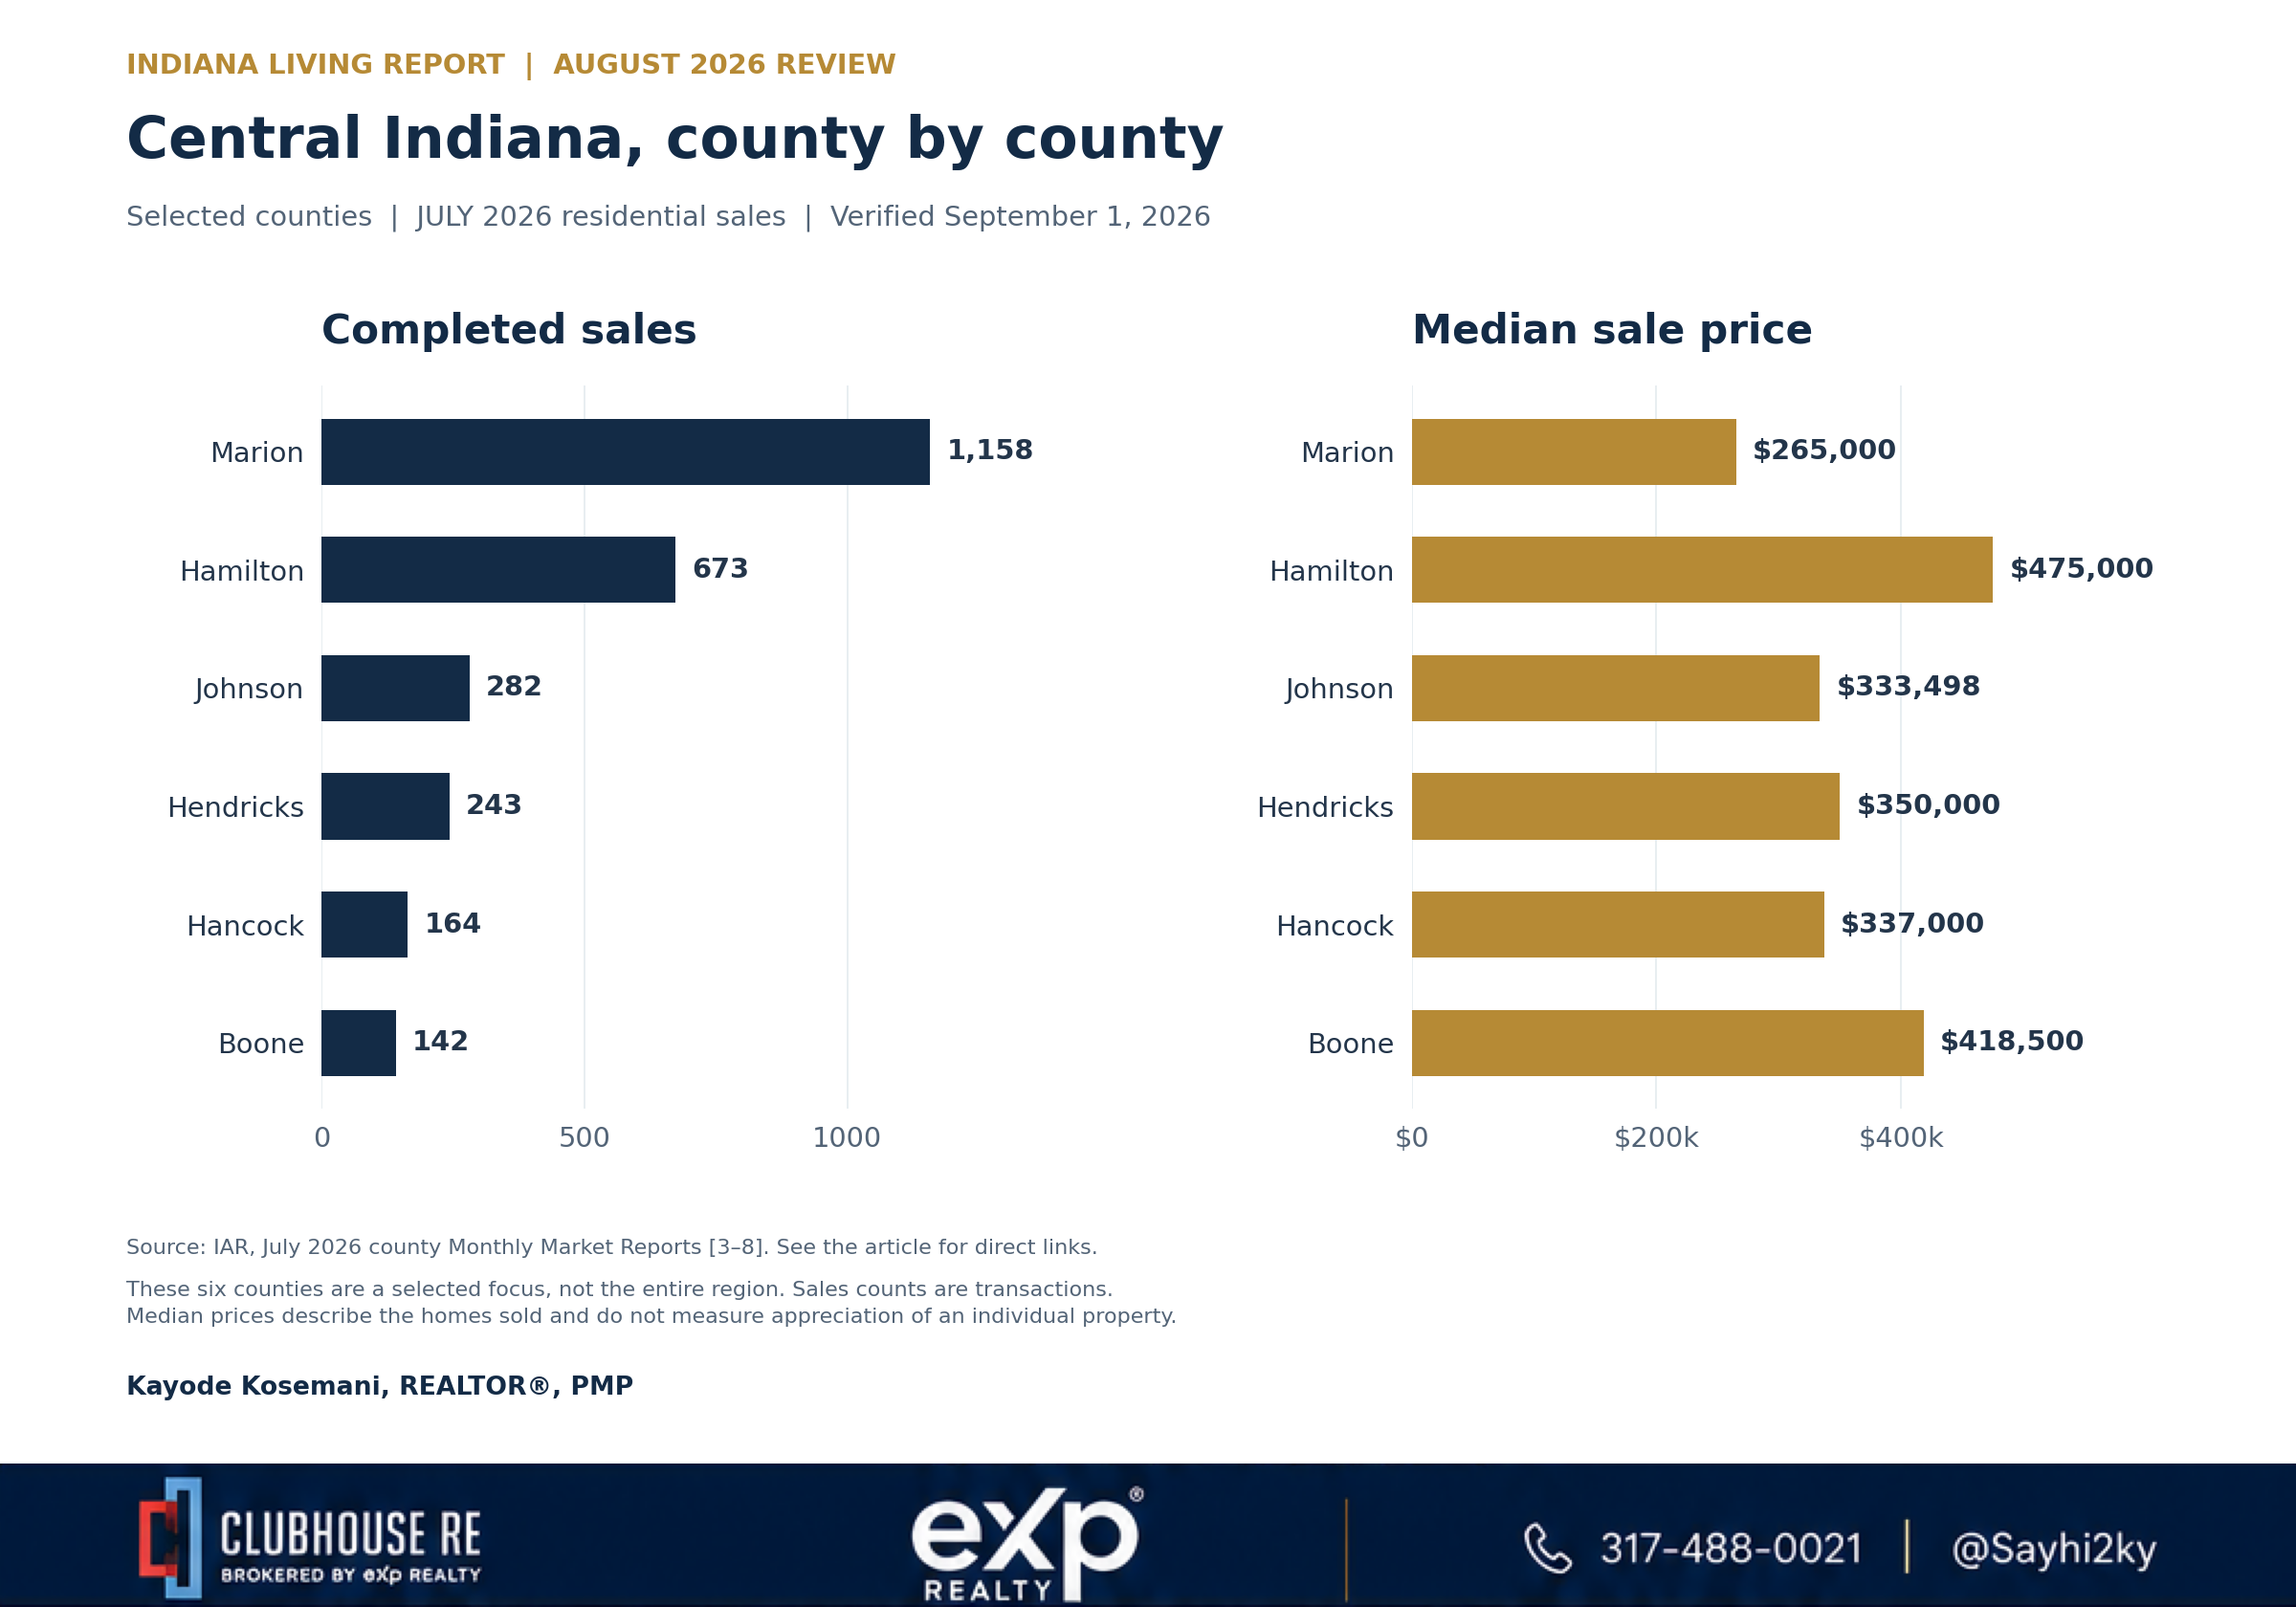
July 2026; selected counties only. ¹Median days from listing to pending. ²Months of inventory, using IAR’s 12-month sales average. Sources: Marion \[3], Hamilton \[4], Johnson \[6], Hendricks \[5], Hancock \[7], Boone \[8].
Marion: its larger supply and longer marketing time than Hamilton give me reasons to investigate negotiation opportunities. I would still compare the exact neighborhood, condition and price bracket. \[3, 4]
Hamilton: the highest median price in this group came with a 15-day median to contract and 1.9 months of inventory, both the lowest in the group. I would not assume a higher asking price means a seller is struggling. \[3–8]
Hendricks: closings fell 13% and pending activity fell 18% year over year, but median time to contract was 18 days. My reading is softer transaction volume with continued competition for some homes; it is not evidence that every listing sits. \[5]
Johnson and Boone had stronger year-over-year closing counts even as their median prices declined; Hancock also combined higher closings with a lower median price. Sales volume and the mix of homes selling can move differently. I would investigate the property before drawing a valuation conclusion. \[6–8]
What NAR’s outlook means for Indianapolis
The National Association of REALTORS® selected Indianapolis as one of its ten homebuying hot spots for 2026. Its December 2025 research emphasized relative affordability, housing availability and employment stability. This was a metro outlook based on earlier evidence, not a report of August 2026 results. \[9]
Two details help explain NAR’s view: Indianapolis had a listings-to-income matching score of 0.89 versus 0.67 nationally, using August 2025 data. NAR also modeled more than 42,700 additional households able to qualify for a median-priced home if mortgage rates moved from 7% to 6%. That is a conditional affordability scenario, not a count of actual buyers or promised approvals. \[9]
I see that recognition as a reason to study Central Indiana seriously. It does not tell me that every property is fairly priced or that borrowing costs have already reached the scenario NAR modeled.
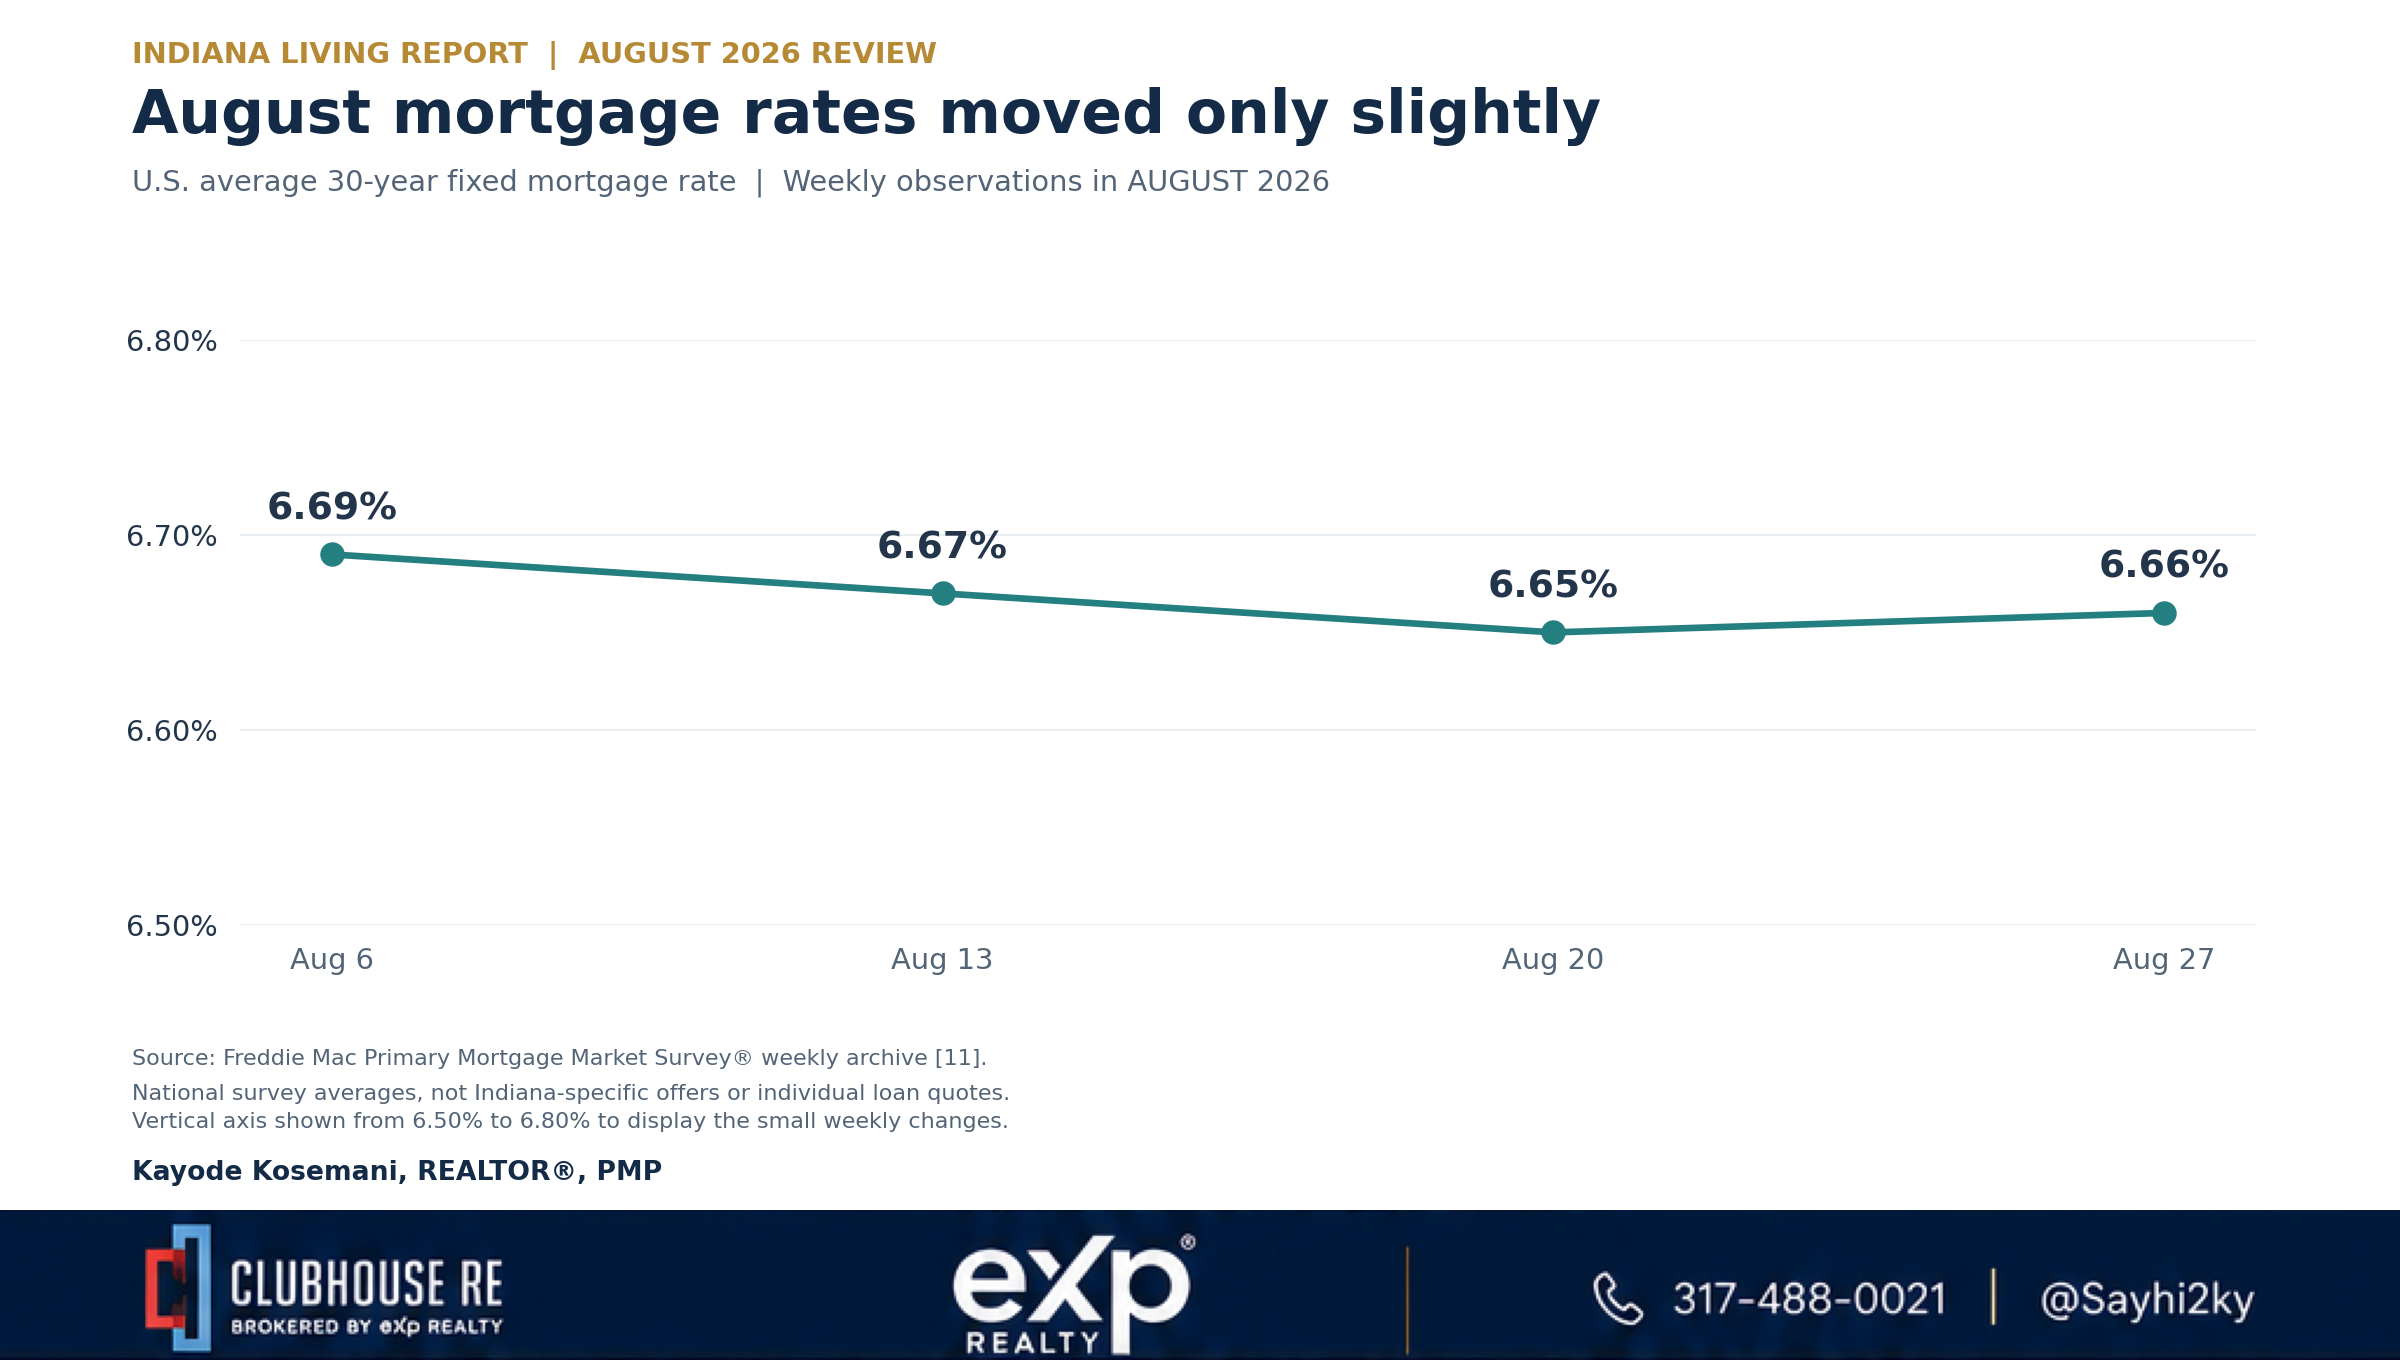
Freddie Mac’s weekly 30-year fixed averages remained within a narrow 6.65%-6.69% range during August. I would build a purchase plan around an actual lender quote and the full housing payment. A possible future refinance should be an option, not the condition that makes today’s purchase affordable. \[11]
National buyer and investor context
NAR’s July release reported U.S. existing-home sales up 0.7% year over year and Midwest sales up 2.1%. Nationally, first-time buyers accounted for 29% of sales, cash transactions 26%, and individual investors or second-home buyers 14%. These categories overlap. The investor figure includes second-home buyers and cannot be applied to Indiana’s closings to estimate local investor purchases. \[10]
What I would tell buyers, sellers and investors
If you are buying
The opportunity is room to compare homes, condition and total cost carefully. The risk is assuming that more inventory automatically means a seller will accept any offer. I would start with a comfortable monthly payment, retain an emergency reserve and get financing reviewed before shopping seriously. Taxes, insurance, HOA charges, mortgage insurance and maintenance belong in that budget.
For a move-up purchase, I would also calculate the cost of replacing the existing mortgage, the likely net proceeds from the sale and the cash needed if the two transactions do not close together. A lower purchase price can still produce a higher monthly obligation.
If you are selling
The opportunity is that completed transactions continue to occur. The risk is pricing from a neighbor’s old result while ignoring the homes buyers can choose today. I would use recent comparable closings, current competing listings, property condition and realistic net proceeds to set the strategy.
IAR’s May pricing study found a seven-day median to contract for homes listed at their eventual sale price. That analysis uses hindsight; nobody knows the final sale price in advance. I take it as support for careful pricing, not a promise that a particular home will sell in a week. \[13]
If you are investing
The opportunity is to compare more properties against a clear return requirement. The risk is confusing an attractive purchase price with a sound investment. I would verify achievable rent, vacancy, insurance, the property’s applicable tax treatment, repairs, management, capital reserves, financing and transaction costs before deciding what I can pay.
My test is whether the property can withstand a vacancy or a major repair without depending on rapid appreciation. For a resale project, I would stress-test the renovation budget, holding period and exit price. For a rental, I would confirm address-specific rental restrictions and requirements before committing. This review does not establish local investor purchase counts, rents, cap rates or expected returns.
A longer-term issue I am watching
IAR’s August 26 study found that one- and two-person households accounted for 76% of Indiana’s net household growth from 2019 to 2024. Yet four-or-more-bedroom homes made up 54% of new single-family homes in 2024. Those are historical structural measures, not August sales statistics. \[12]
That raises a practical question for me: are we offering enough housing at the sizes and total costs people can use? I would investigate smaller homes and suitable rehabilitation opportunities where the numbers and permitted use support them. Household growth alone does not prove demand for a specific property.
My focus is helping you connect the market evidence to a decision you can afford and sustain.
If you are considering buying, selling or investing in Central Indiana, let’s look at your location, timeline and numbers together. Helping hardworking Hoosiers become homeowner-ready.
How I read the data
This is a residential market review. It does not measure all commercial property, land, off-market transfers or every rental transaction. The monthly tables use IAR’s all-residential series consistently; NAR’s national existing-home series has a different scope. County medians are not appraisals, and changes can reflect which homes sold.
IAR announced corrections and a rebuilt history on August 17, including duplicate handling, pending-event counting and reporting cutoffs. I used the retrieved monthly reports and their rounded comparisons rather than combining unreconciled older releases. Some dashboard change badges differed from report values; the tables follow the monthly reports. \[14]
MIBOR’s own July PDF could not be retrieved during this review. The Central Indiana aggregate is therefore explicitly attributed to IAR’s MIBOR association geography. It should not be presented as a quotation from MIBOR’s separate publication. \[2, 17]
The wording separates reported figures from my interpretation. August closing totals and verified Indiana investor counts remain unavailable in the sources reviewed. All links below were checked on September 1, 2026.
Sources and reporting periods
- IAR, Indiana monthly report. July 2026; all residential.
- IAR, MIBOR association-area monthly report. July 2026; 14-county association geography.
- IAR, Marion County monthly report. July 2026.
- IAR, Hamilton County monthly report. July 2026.
- IAR, Hendricks County monthly report. July 2026.
- IAR, Johnson County monthly report. July 2026.
- IAR, Hancock County monthly report. July 2026.
- IAR, Boone County monthly report. July 2026.
- NAR, Housing Hot Spots for 2026. Published December 9, 2025; pp. 11 and 19.
- NAR, Existing-Home Sales report for July. Published August 11, 2026; national and regional context.
- Freddie Mac, PMMS weekly archive. August 6, 13, 20 and 27, 2026; U.S. averages.
- IAR, How We Live, Where We Buy, What We Build. Published August 26, 2026; underlying periods vary.
- IAR, The Price Is (Still) Right: 2026 Update. Published May 12, 2026; May 2025-April 2026 sales.
- IAR, What We Fixed in Our Housing Data. Published August 17, 2026.
- IAR, MIBOR association market dashboard. Weekly observations labeled week of August 17, 2026.
- IAR latest reports; MIBOR report archive. Availability checked September 1, 2026.
- MIBOR, Market Insights Report Archive. Archive listed January-July 2026 when checked.
Educational market commentary, not an appraisal or a guarantee of financing, appreciation, rental income or investment performance. Kayode Kosemani, REALTOR®, PMP, is an Indiana licensed real estate professional with eXp Realty and a member of Clubhouse RE Mega Team. Clubhouse RE is brokered by eXp Realty. Equal Housing Opportunity.
CONNECT WITH CHERVIL LLC
Have a question about this topic?
Use this resource as a starting point, then contact Chervil LLC when you need guidance connected to your individual circumstances.